40502’s Million-Dollar Market Nearly Doubled This Summer
October 19, 2026
October 19, 2026
Last summer, 14 homes in 40502 sold for $1 million or more. This summer, 27 did. Chevy Chase, Ashland Park, Lakewood had an incredible third quarter, and the zip code's median sale price moved up nearly 25% over 2025, to about $720K.
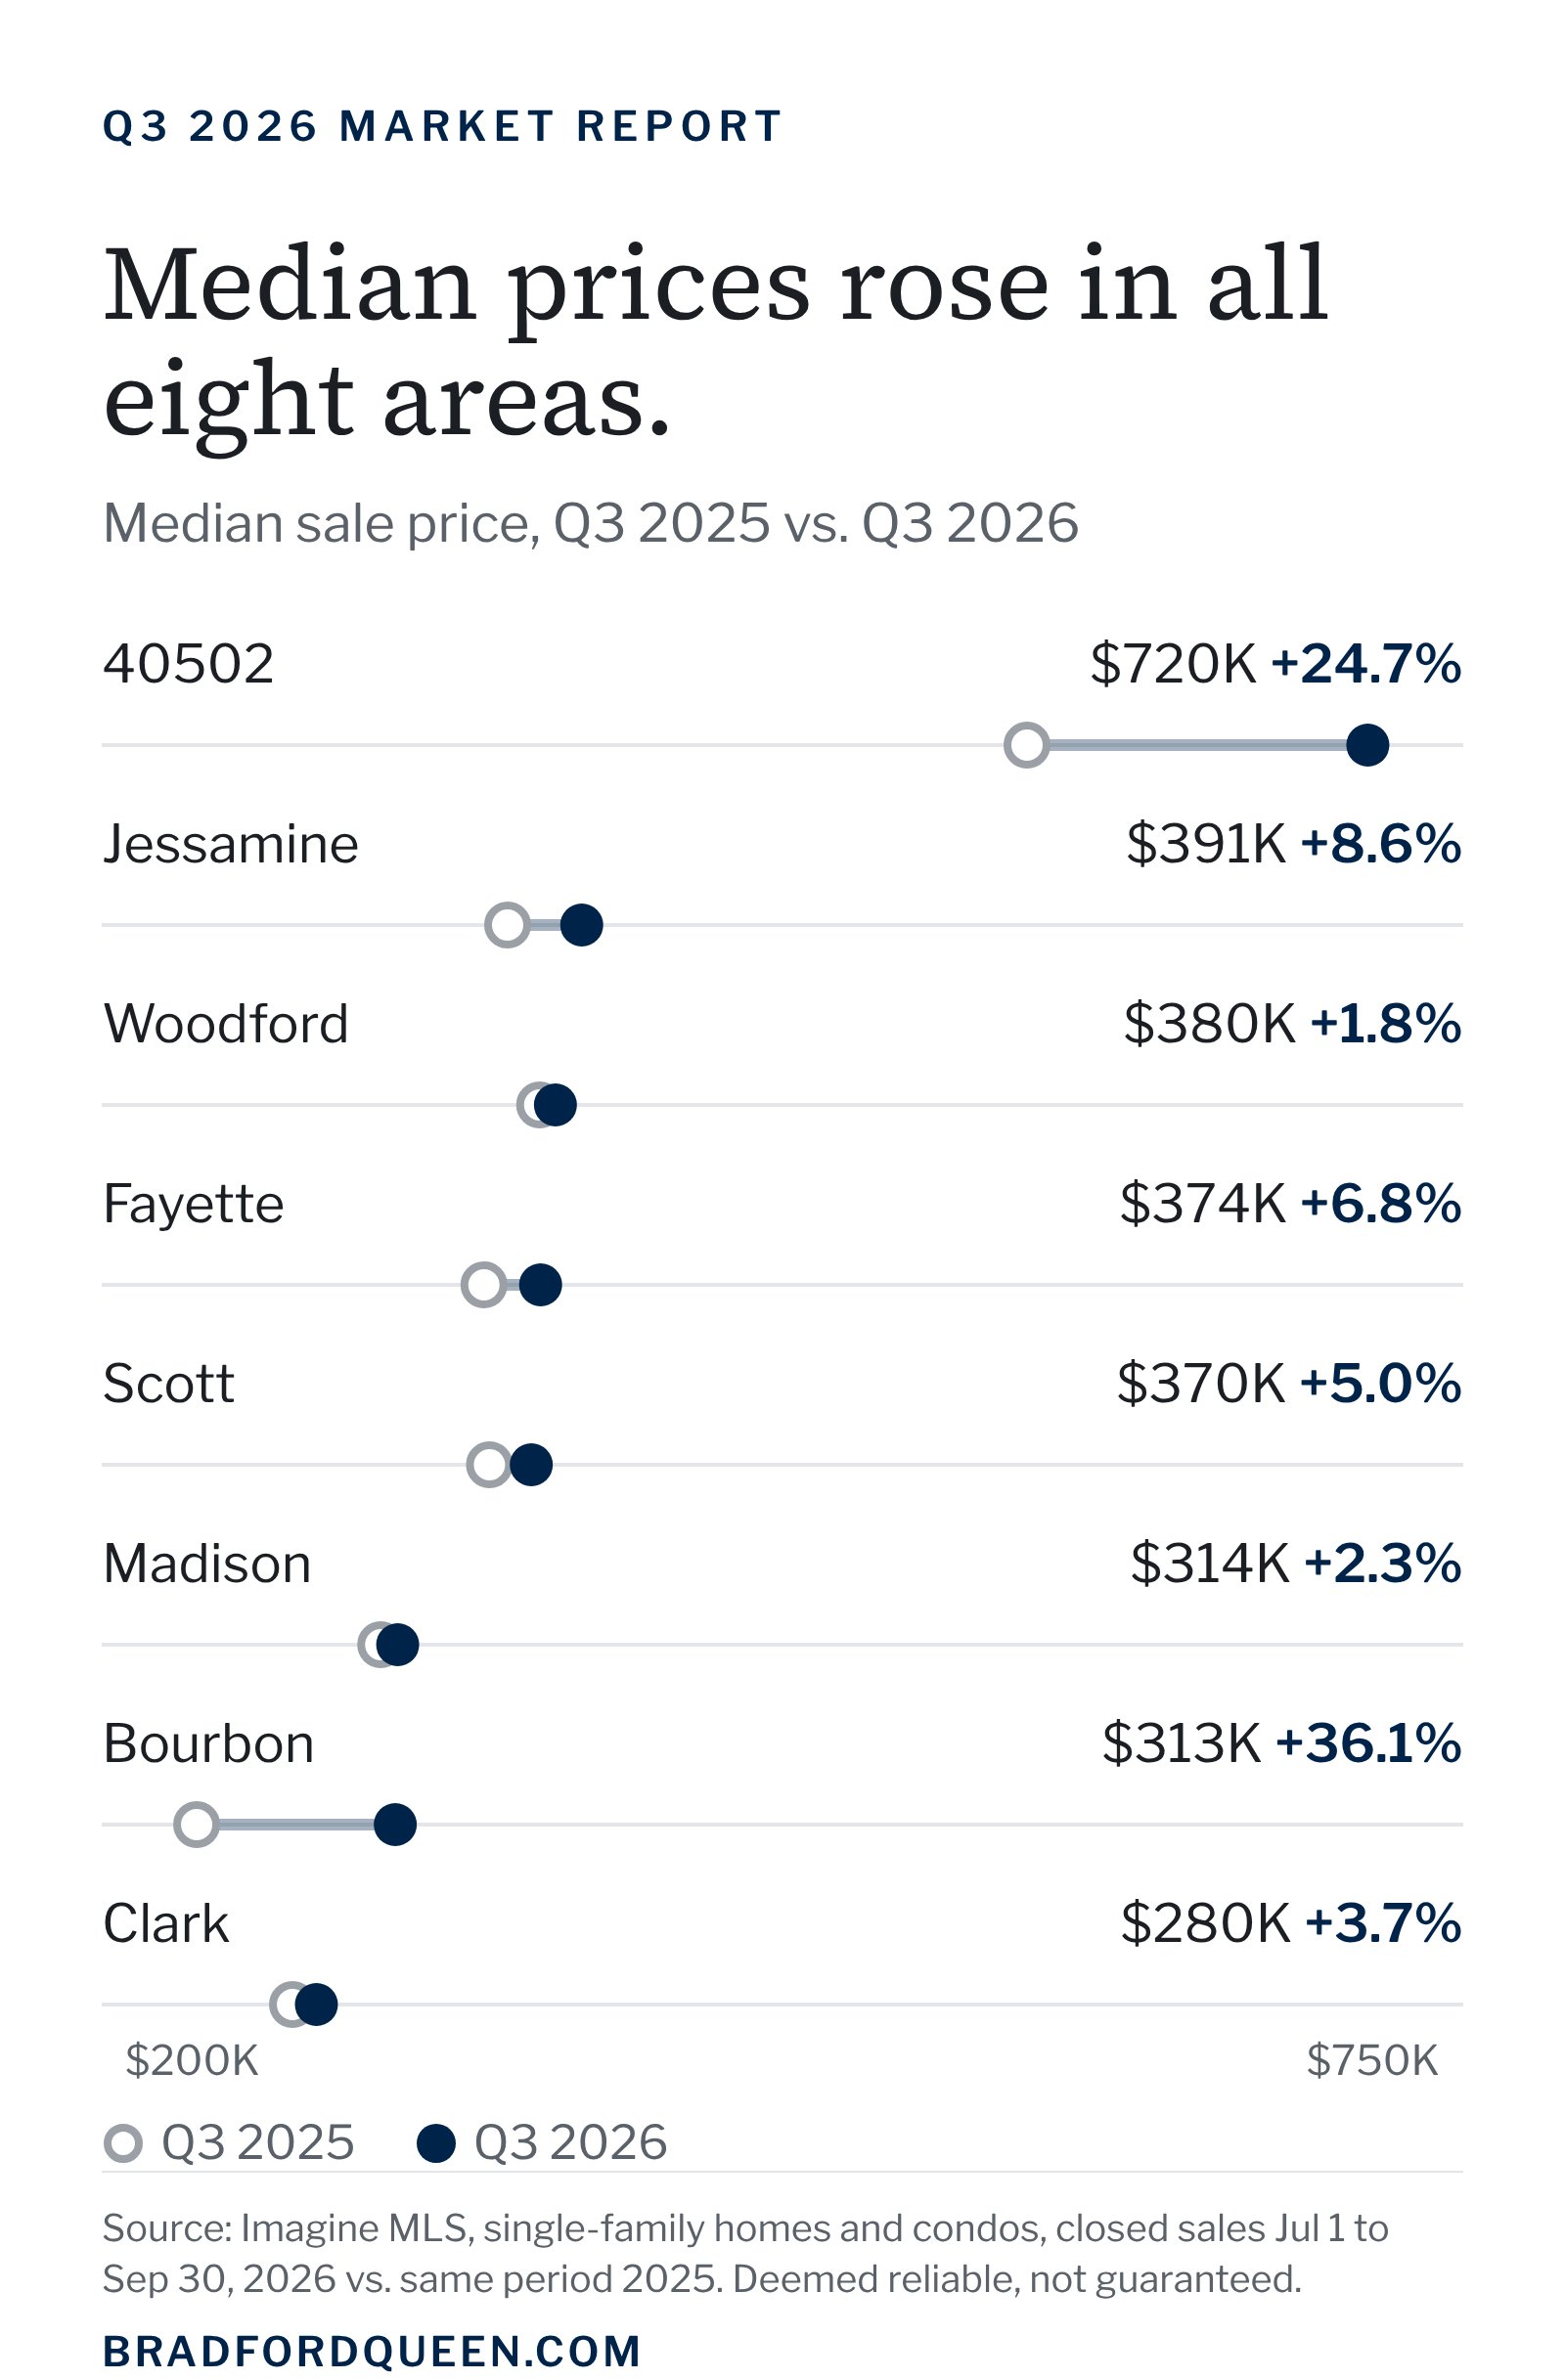
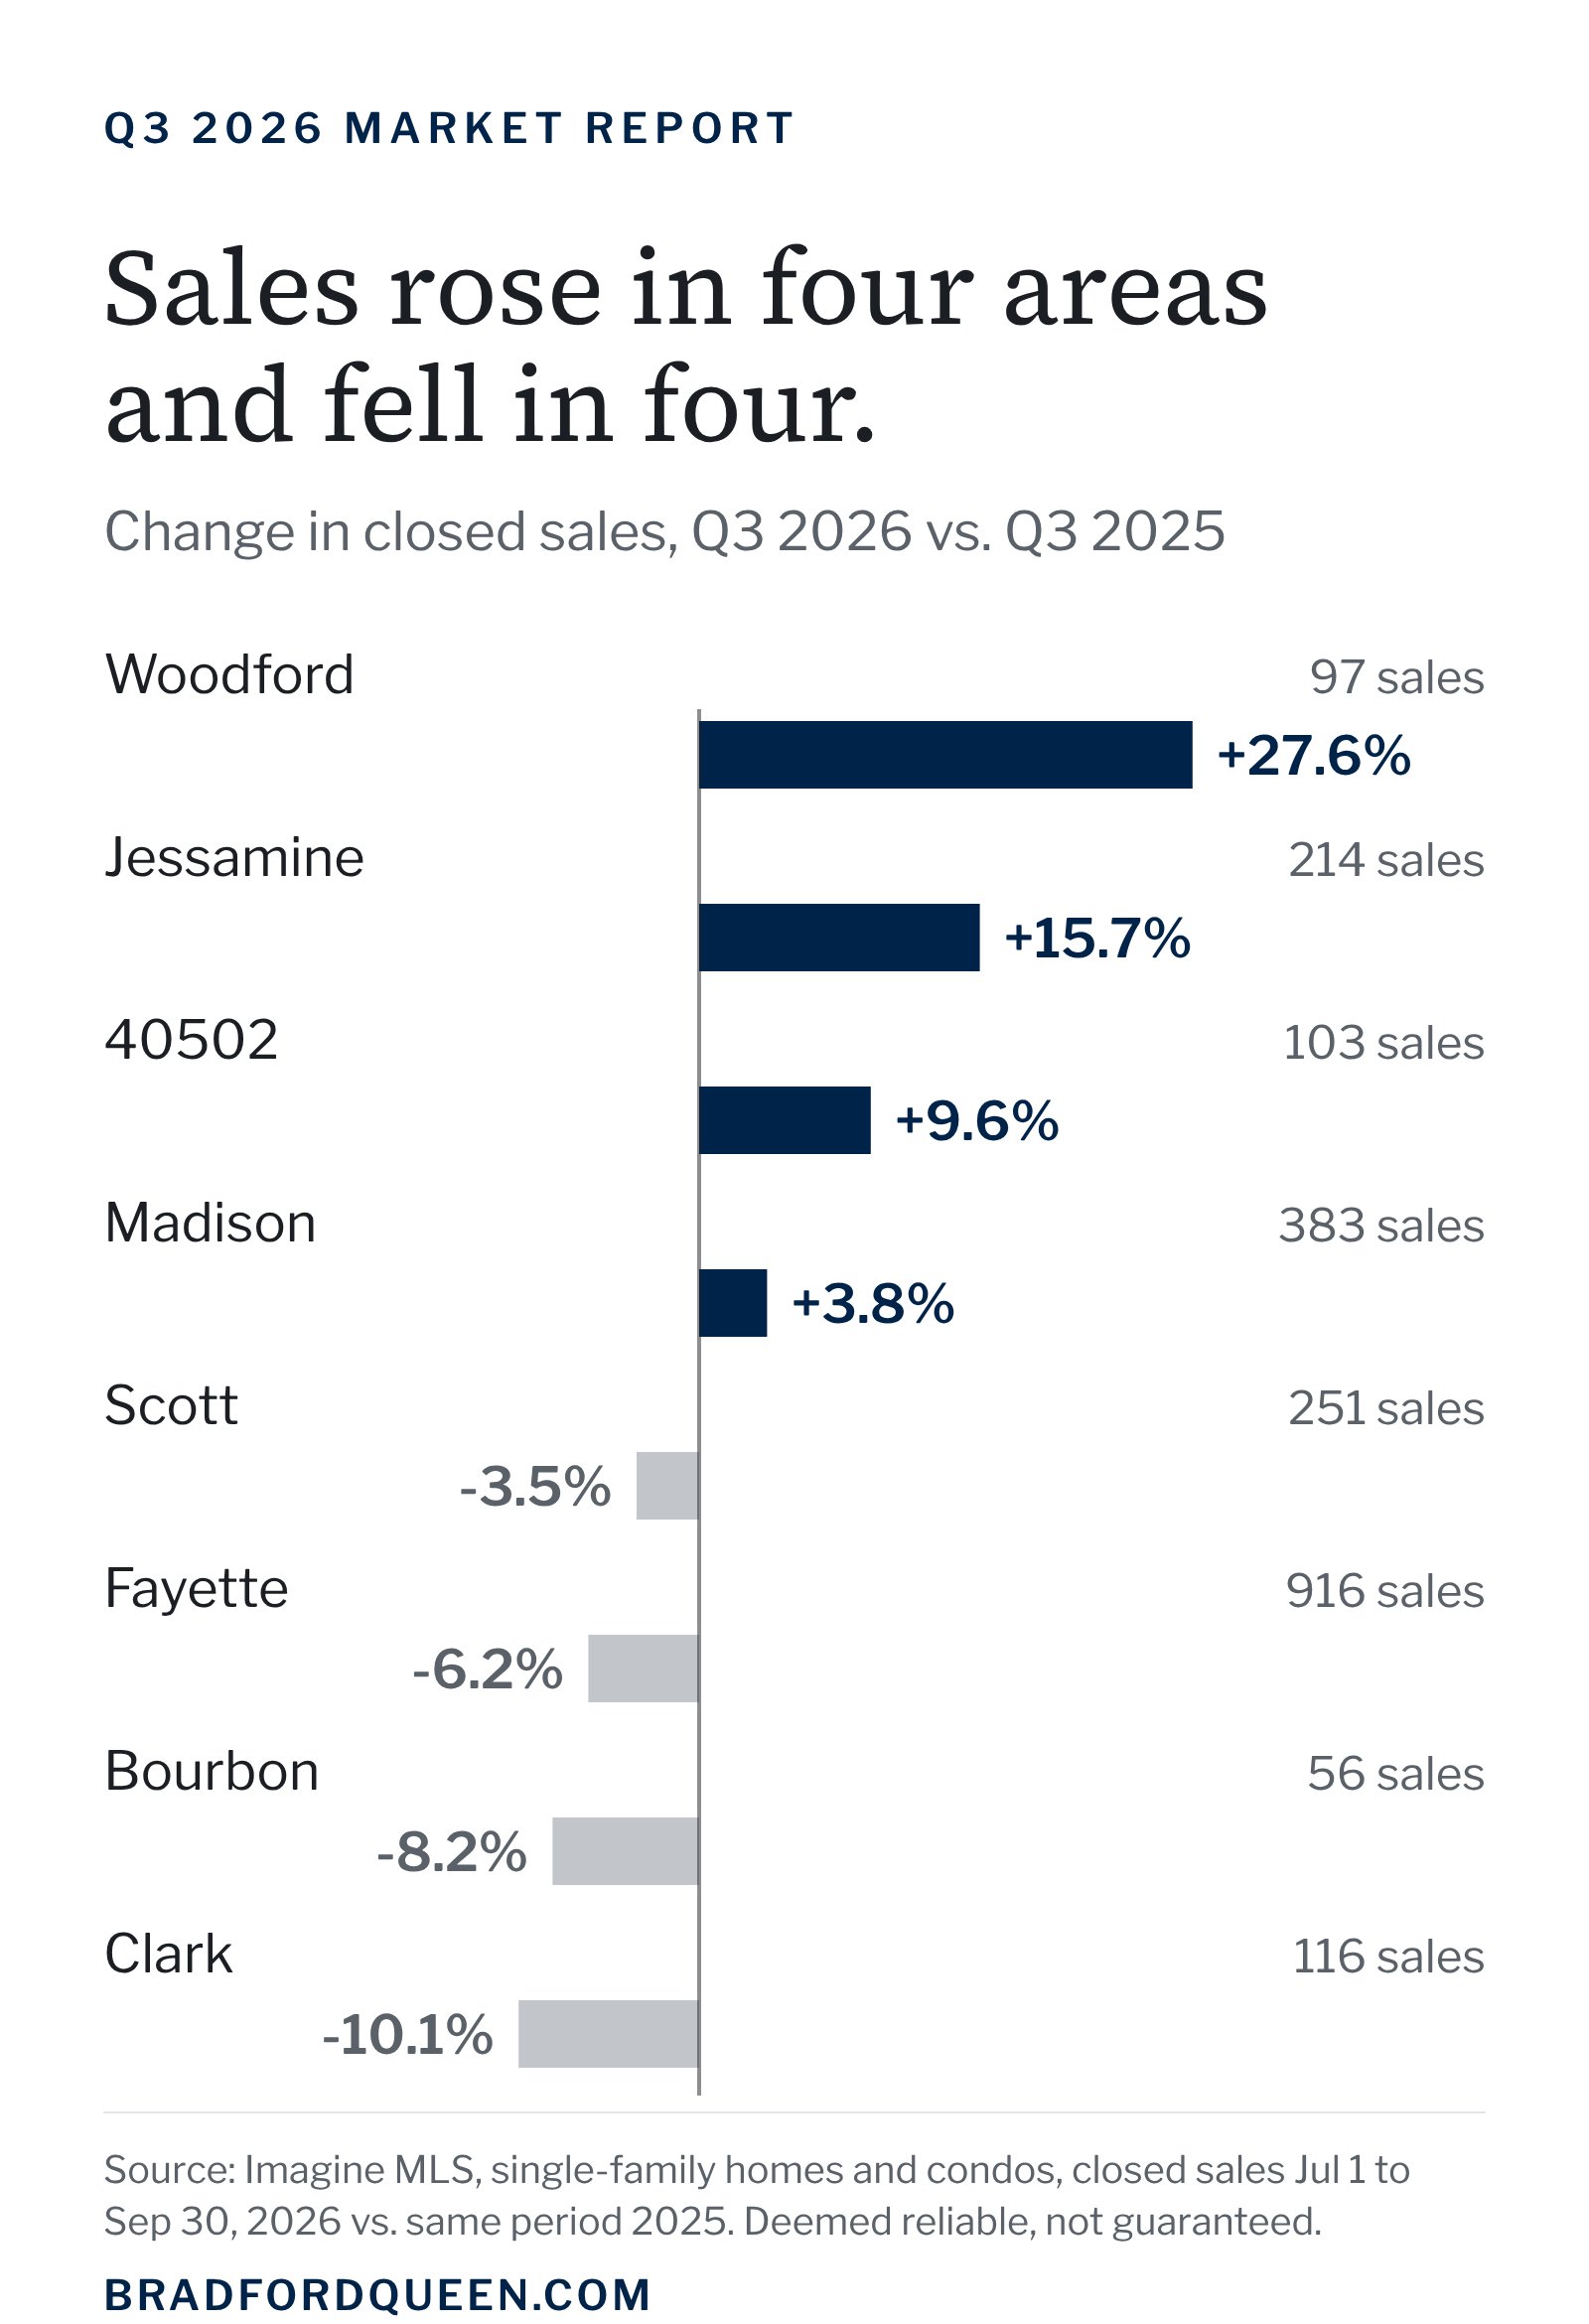
The rest of Central Kentucky was steadier. Median prices rose in all eight areas I track, while sales were up in four and down in four. Here is what happened from July through September, area by area, compared with the same three months of 2025.
Median prices rose year over year in all eight areas. Sales slowed in four of them.
Sales and prices
Area | Closed sales | Median price | Median YoY |
|---|---|---|---|
Fayette | 916 (-6.2%) | $374K | +6.8% |
40502 | 103 (+9.6%) | $720K | +24.7% |
Jessamine | 214 (+15.7%) | $391K | +8.6% |
Madison | 383 (+3.8%) | $314K | +2.3% |
Woodford | 97 (+27.6%) | $380K | +1.8% |
Scott | 251 (-3.5%) | $370K | +5.0% |
Bourbon | 56 (-8.2%) | $313K | +36.1% |
Clark | 116 (-10.1%) | $280K | +3.7% |
Pace and supply
Area | New contracts | Average Days on Market | Months of supply* |
|---|---|---|---|
Fayette | 835 (-6.4%) | 24 | 2.4 |
40502 | 90 (+9.8%) | 40 | 1.9 |
Jessamine | 188 (+4.4%) | 41 | 2.8 |
Madison | 349 (-6.4%) | 51 | 3.2 |
Woodford | 88 (+7.3%) | 42 | 2.5 |
Scott | 214 (-7.4%) | 33 | 2.1 |
Bourbon | 59 (-9.2%) | 66 | 2.7 |
Clark | 92 (-29.8%) | 45 | 3.1 |
Single-family homes and condos, Q3 2026 (July through September). Percentages compare with Q3 2025. Area names are counties except 40502, which is also counted inside Fayette County. New pendings are contracts written during the quarter, so they hint at where closings are headed next.
*Months of supply covers all residential property types.
Lexington gave buyers more to choose from without giving up on price. Active listings ended September up 7.6% from a year ago, and supply moved from 2.1 to 2.4 months. Even so, the median climbed 6.8% to about $374K, and homes still went under contract in 24 days on average.
The zip code had a standout summer. Sales rose 9.6% and the median jumped 24.7% to about $720K, largely because more of the quarter's sales were high-end homes: 50 of 103 closed at $750K or more, up from 34 a year ago. The surprise in 40502 is who drove the jump. Cash buyers closed 10 of the 27 sales over $1 million, up from 8 a year ago. Financed buyers closed 17, up from 6. In all, 50 of the zip code's 103 sales were at $750K or more.
The tradeoff is time. Homes took 40 days on average to go under contract, up from 25. Buyers here are still paying for the right house. They are just taking longer to decide.
Jessamine had one of the region's strongest quarters. Sales rose 15.7% to 214, the median climbed 8.6% to about $391K, and homes went under contract in 41 days on average, a little faster than last year. It is also the deepest luxury market outside Lexington: 21 sales at $1 million or more, up from 16, more than the other five surrounding counties combined. Builders were busy here too, with 44 new construction closings, up from 29.
Madison was the steadiest market in the group. Sales were up 3.8% and the median rose 2.3% to about $314K. Inventory rose 11.5% to 397 homes, giving Richmond and Berea 3.2 months of supply, the closest thing to a balanced market in the region.
Versailles and Midway closed 27.6% more homes than last summer, and the gains came at higher price points: sales of $750K and up nearly doubled, from 7 to 13. The median edged up 1.8% to about $380K. New listings fell, so expect inventory to tighten into fall.
Georgetown is the tightest market on this list. Active listings fell 21% to 180, homes went under contract in 33 days on average instead of 52, and the median rose 5.0% to about $370K. The shift is coming from resale homes, which closed 12% more often, while new construction closings fell from 74 to 43.
Paris had fewer sales but bigger ones. The median rose 36% to about $313K, driven by five sales at $750K or more after none in Q3 2025. With only 56 sales in the quarter, a handful of farms and estate homes can move the numbers, so read the percentages with that in mind. Homes took 66 days on average to go under contract, about twice last year's pace.
Winchester remains the region's most approachable price point, with a median of $280K, up 3.7%. Activity cooled noticeably: sales fell 10% and new pendings fell 30%. Supply held at 3.1 months, so buyers have room to negotiate.
Luxury was the strongest part of the market this summer. Across the seven counties, 168 homes sold for $750K or more, up from 152 a year ago, for $187.2 million in total sales. The gains were concentrated in Lexington's best-known neighborhoods.
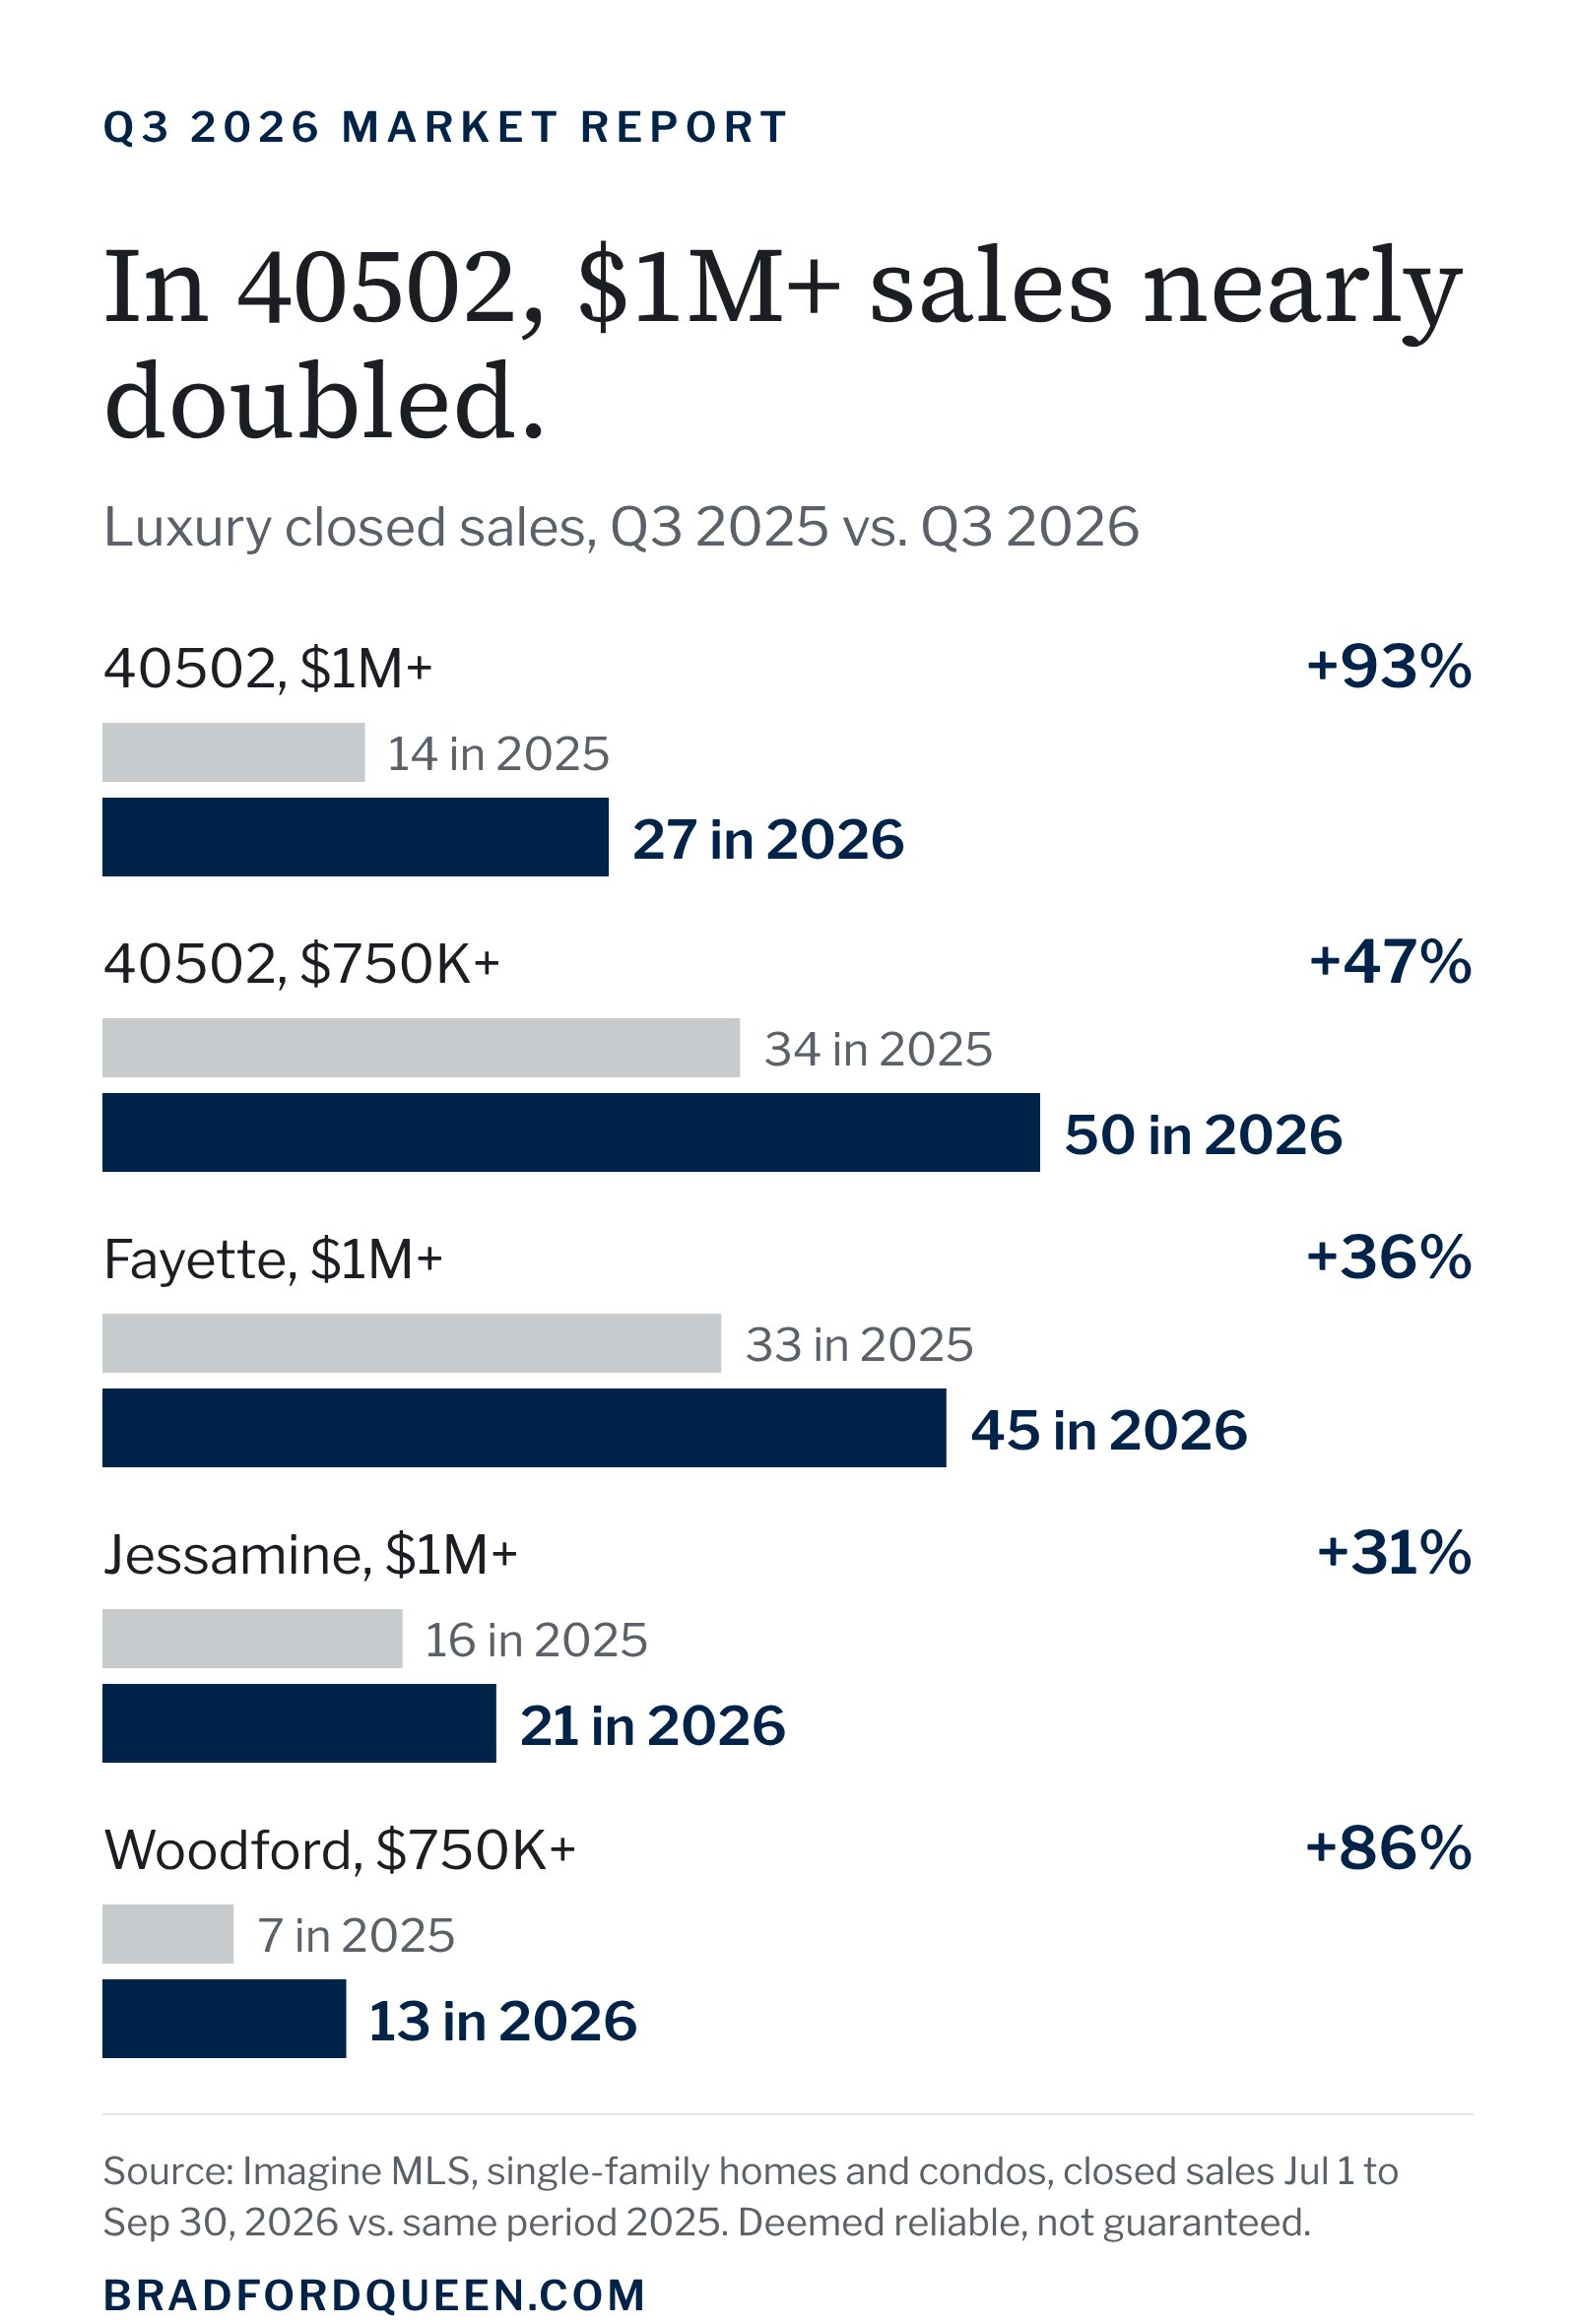
Outside Fayette, Jessamine stands apart with 30 sales over $750K and 21 over $1M. The other five counties combined had 41 sales over $750K and five over $1M.
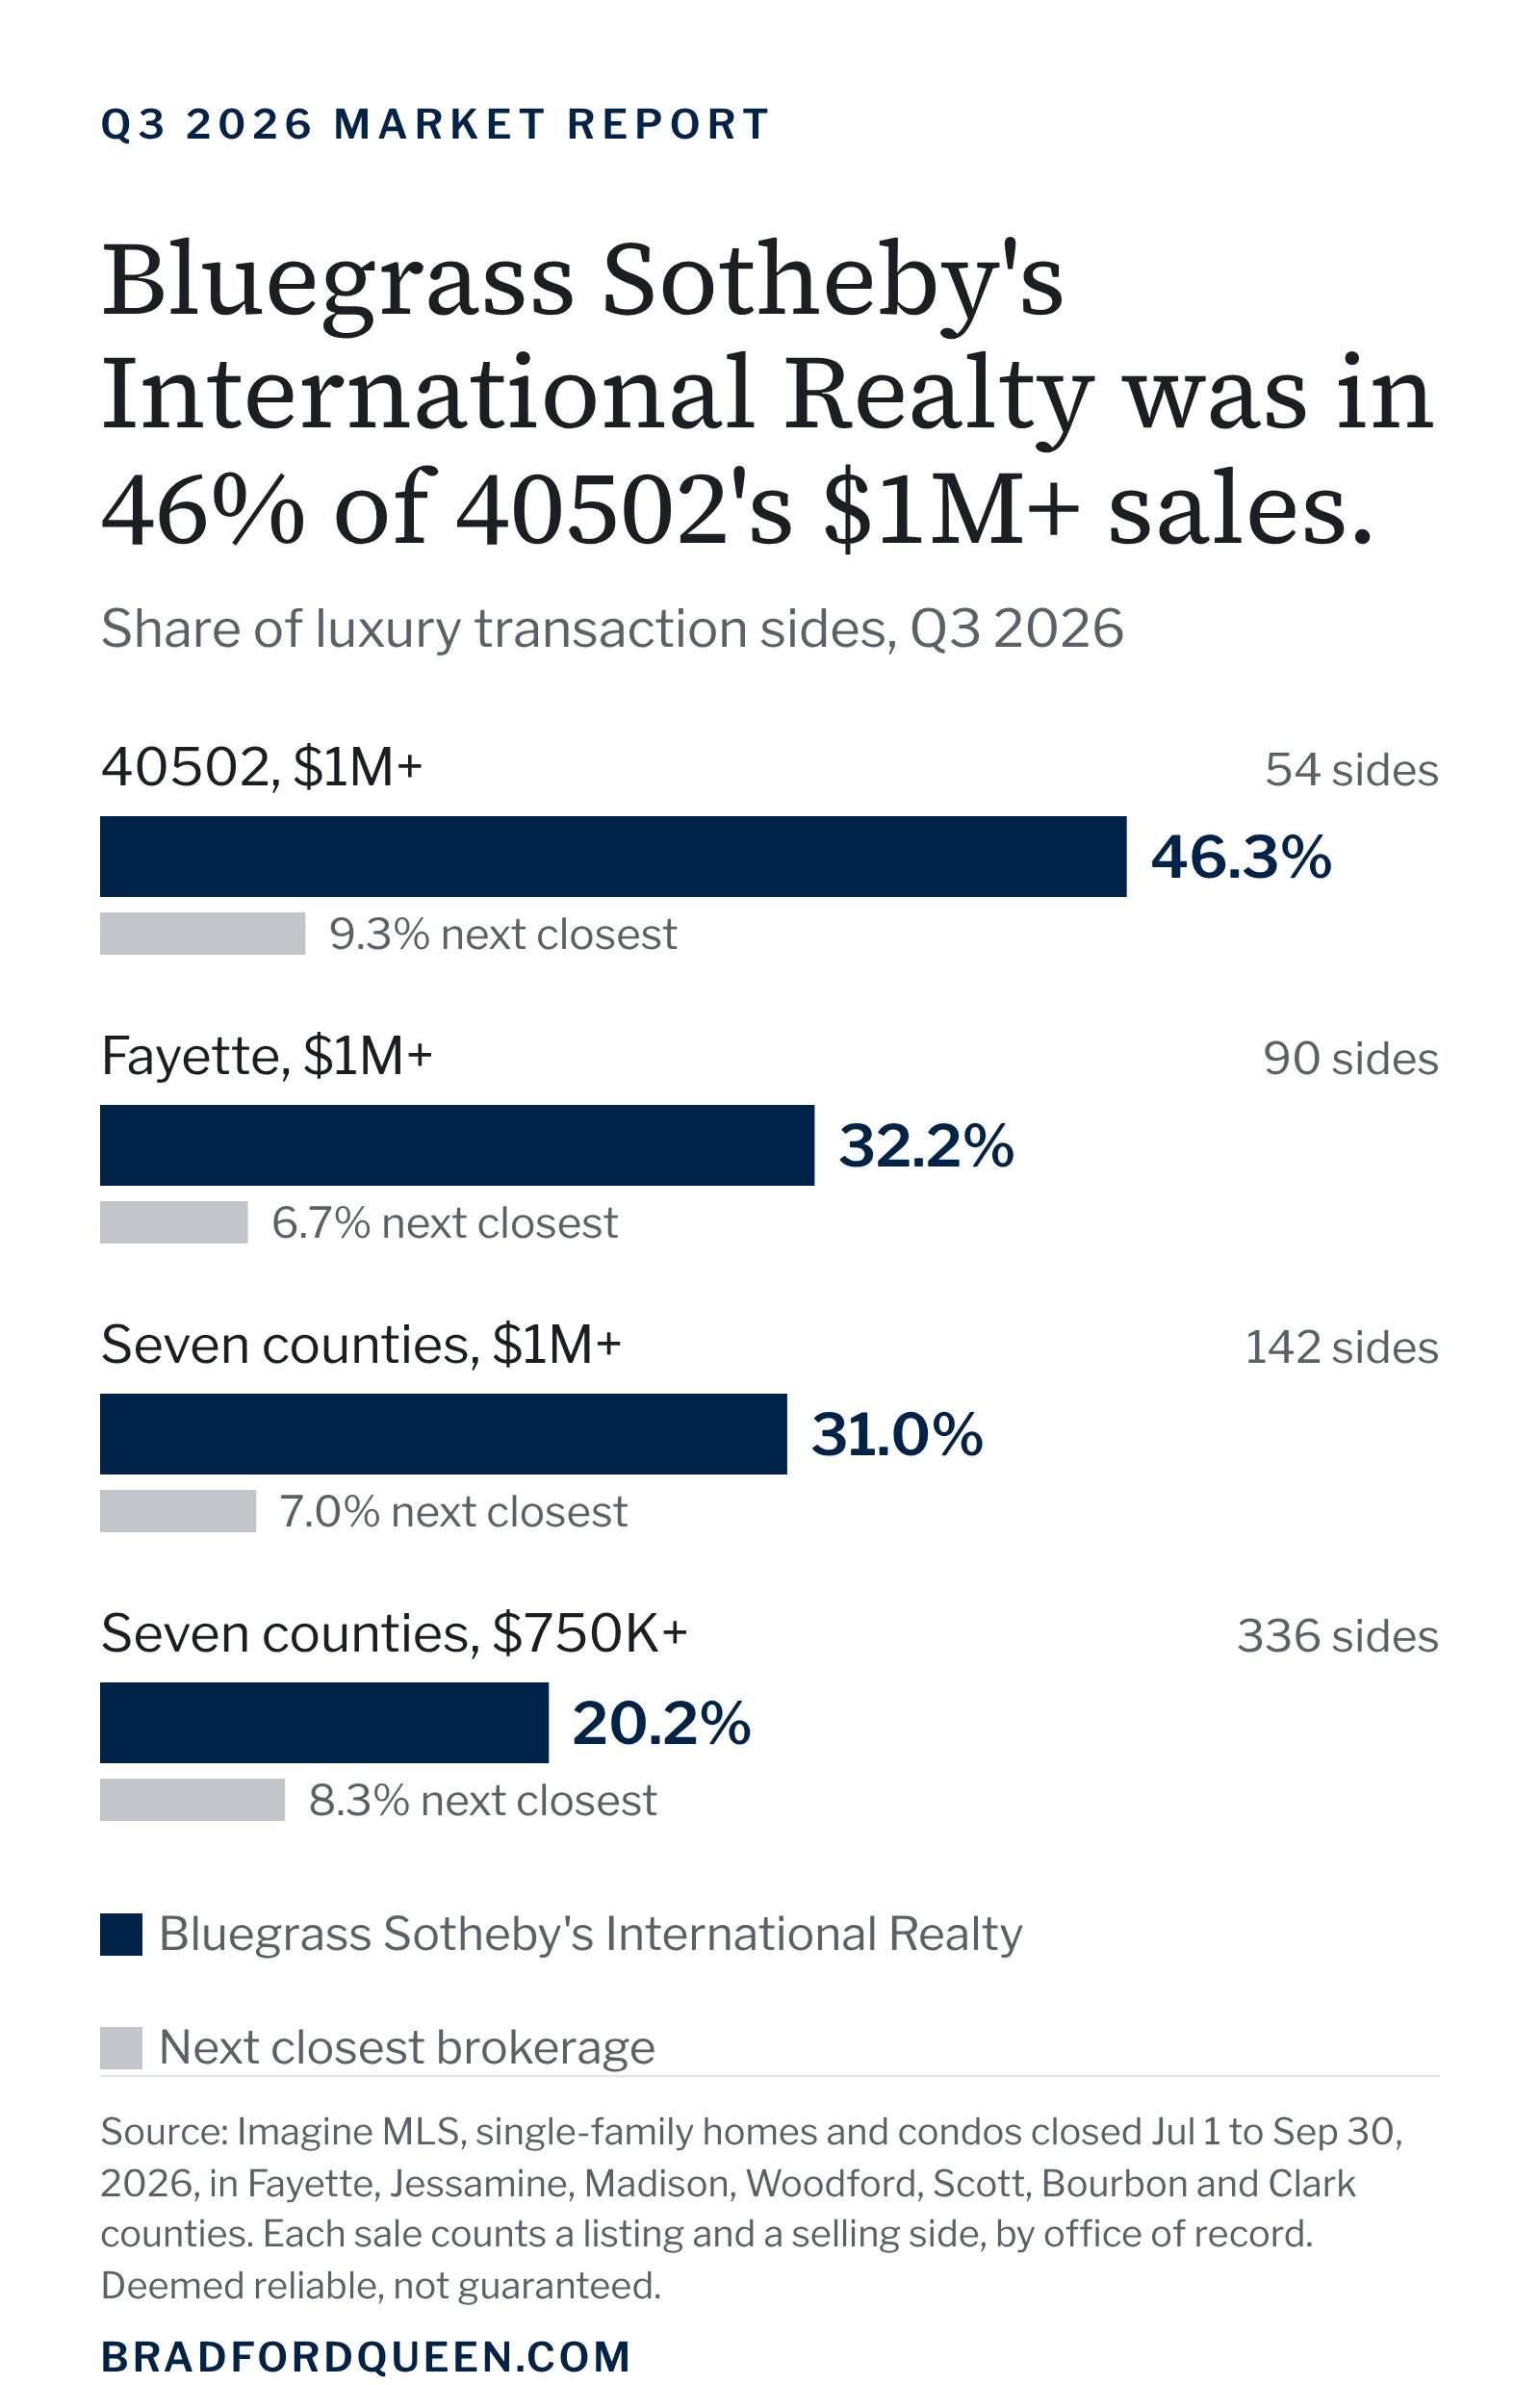
Bluegrass Sotheby's International Realty was involved in more luxury sales than any other brokerage in the seven-county region this quarter, at both $750K and $1M and above.
Segment, Q3 2026 | BGSIR sides | Share |
|---|---|---|
Seven counties, $750K+ | 68 of 336 | 20.2% |
Seven counties, $1M+ | 44 of 142 | 31.0% |
Fayette, $1M+ | 29 of 90 | 32.2% |
40502, $1M+ | 25 of 54 | 46.3% |
The next closest brokerage had 28 sides at $750K+ and 10 sides at $1M+ across the seven counties.
On the listing side alone, Bluegrass Sotheby's International Realty represented the seller on 25 of the region's 71 sales over $1M (35%), and on 14 of the 27 in 40502. Counted by sale rather than side, the firm was involved in 18 of those 27 sales in 40502, two of every three. A transaction side is one brokerage representing either the seller or the buyer, so every sale has two.
If you're selling, values are holding, but buyers are taking their time, especially above $750K. Homes priced right from day one are still selling close to asking. Homes that start high are sitting longer and giving more back. Presentation and pricing strategy matter more this fall than they did a year ago.
If you're buying, you have more choice in Lexington, Madison and Woodford than you did a year ago, and more room to negotiate on homes that have been on the market a few weeks. In Scott, homes are going under contract in about a month, so be ready when the right one comes up.
Every neighborhood moves a little differently than the county numbers suggest. If you'd like to know what this quarter means for your home or your search, I'm always glad to talk it through.
Source: Imagine MLS via Flexmls, pulled October 19, 2026. Closed sales by close date, July 1 through September 30, 2026, compared with the same period in 2025. New pendings are contracts written in the quarter. Days to contract runs from listing date to contract date. Active listings and months of supply cover all residential property types, and months of supply is September 30 active listings divided by the quarter's average monthly closings. Brokerage share counts each closed sale's listing and selling office as recorded in the MLS. Information is deemed reliable but not guaranteed, and figures may change as late sales are reported.
Q3 2026 Central Kentucky Market Report

Every move is unique, and success is measured by both the experience and the outcome. In partnership with Bradford, every detail will be handled with persistence, discretion, and care.
Let's Connect
Bluegrass Sotheby's International Realty 1999 Richmond Road, Suite 400 Lexington, Kentucky 40502